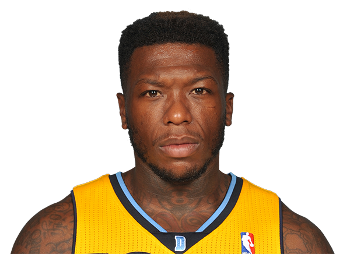
SG - Nate Robinson
Philadelphia 76ers
5'9'' | 180 lbs | Washington | 30yRound : 1 Pick : #7 | > TC
| Min | Pts | Reb | Ast | Rkg |
|---|---|---|---|---|
| 15,3 | 5,5 | 2,3 | 1,6 | 6,5 |

Player Main Ratings
Player Salaries
| Year | Salaries |
|---|---|
| Year 1 | 8 000 000 $ |
Free Agency Expected
| Year | Salaries |
|---|---|
| Year 1 (max) | 21 000 000 $ |
| Year 4 | 27 300 000 $ |
Player Expected
| Loyalty : | 6 |
|---|---|
| Greed : | 52 |
| Play For Winner : | 52 |
| Bird Years : | 9 |
| Experience : | 9 |
| Sign Year : | 2015 |
| Sign Day : | 182 |
Ratings Player
| Inside Scoring | C | Post Def. | C- | Strength | C |
| Jumpshot | B- | Perimeter Def. | C+ | Jumping | A |
| Three Point | A+ | Drive Def. | C+ | ||
| Handling | B+ | Stealing | B+ | ||
| Passing | C+ | Shot Blocking | D | ||
| Quickness | B+ | Off. Rebound | C- | ||
| Def. Rebound | C |
Last 10 Games
| Day | Team | Opp. | Min | FG | FGA | 3P | 3PA | FT | FTA | Reb | Ast | Stl | Blk | Tos | Fls | Pts | Rk |
|---|---|---|---|---|---|---|---|---|---|---|---|---|---|---|---|---|---|
| 141 | PHI | IND | 27 | 6 | 11 | 1 | 4 | 3 | 6 | 3 | 1 | 2 | 0 | 1 | 1 | 16 | 13 |
| 139 | PHI | IND | 20 | 4 | 4 | 3 | 3 | 1 | 2 | 2 | 4 | 5 | 0 | 0 | 1 | 12 | 22 |
| 137 | PHI | IND | 22 | 3 | 7 | 1 | 3 | 1 | 2 | 8 | 3 | 2 | 0 | 0 | 0 | 8 | 16 |
| 136 | PHI | IND | 21 | 3 | 9 | 1 | 2 | 1 | 2 | 1 | 2 | 0 | 0 | 2 | 1 | 8 | 2 |
| 134 | PHI | IND | 23 | 6 | 9 | 2 | 4 | 1 | 2 | 3 | 2 | 0 | 0 | 3 | 0 | 15 | 13 |
| 133 | PHI | IND | 33 | 5 | 11 | 2 | 5 | 1 | 1 | 1 | 7 | 1 | 0 | 1 | 1 | 13 | 15 |
| 130 | PHI | MIA | 36 | 8 | 19 | 1 | 4 | 0 | 0 | 8 | 2 | 2 | 0 | 1 | 0 | 17 | 17 |
| 128 | PHI | MIA | 24 | 0 | 5 | 0 | 2 | 0 | 0 | 7 | 4 | 0 | 0 | 0 | 2 | 0 | 6 |
| 126 | PHI | MIA | 14 | 0 | 4 | 0 | 1 | 0 | 0 | 2 | 2 | 1 | 0 | 0 | 0 | 0 | 1 |
| 125 | PHI | MIA | 9 | 1 | 3 | 0 | 1 | 3 | 3 | 2 | 0 | 1 | 0 | 0 | 1 | 5 | 6 |
| - | - | - | 22,9 | 43,9 % | 37,9 % | 61,1 % | 3,7 | 2,7 | 1,4 | 0,0 | 0,8 | 0,7 | 9,4 | 11,1 | |||
> Game By Game
> Generate Player Stats
Season Percentage
| Field Goals % | Three Points % | Free Throws % |
|---|---|---|
44,5 % | 40,0 % | 74,1 % |
Playoffs Stats
| Min | Pts | Reb | Ast | Stl | Blk | FG | FT | 3pts | Rkg |
|---|---|---|---|---|---|---|---|---|---|
| 21,8 | 8,8 | 3,6 | 2,4 | 1,3 | 0,0 | 44,4 % | 57,9 % | 40,0 % | 10,4 |
Playoffs Stats
Playoffs Stats 1st Round vs Heat
| Min | Pts | Reb | Ast | Stl | Blk | FG | FT | 3pts | Rkg |
|---|---|---|---|---|---|---|---|---|---|
| 19,2 | 5,5 | 4,2 | 1,7 | 0,8 | 0,0 | 33,3 % | 75,0 % | 28,6 % | 7,3 |
Playoffs Stats 2nd Round vs Pacers
| Min | Pts | Reb | Ast | Stl | Blk | FG | FT | 3pts | Rkg |
|---|---|---|---|---|---|---|---|---|---|
| 24,3 | 12,0 | 3,0 | 3,2 | 1,7 | 0,0 | 52,9 % | 53,3 % | 47,6 % | 13,5 |
Stats Win / Lost
| W/L | G | Min | Ppg | Rpg | Apg | Spg | Bpg | Tpg | Fpg | FG/FGA | FG% | FT/FTA | FT% | 3P/3PA | 3P% | Rkg |
|---|---|---|---|---|---|---|---|---|---|---|---|---|---|---|---|---|
| W | 45 | 14,7 | 6,4 | 2,4 | 1,3 | 0,8 | 0,1 | 0,9 | 0,6 | 108/224 | 48,2 % | 35/47 | 74,5 % | 36/81 | 44,4 % | 7,2 |
| L | 49 | 17,4 | 5,5 | 2,5 | 2,0 | 0,8 | 0,1 | 0,8 | 0,9 | 102/248 | 41,1 % | 36/53 | 67,9 % | 30/84 | 35,7 % | 6,8 |
Career Stats
| Yr | Team | G | Min | Ppg | Rpg | Apg | Spg | Bpg | Tpg | FG/FGA | FG% | FT/FTA | FT% | 3P/3PA | 3P% | Rkg |
|---|---|---|---|---|---|---|---|---|---|---|---|---|---|---|---|---|
| 2015 | PHI | 82 | 15,3 | 5,5 | 2,3 | 1,6 | 0,8 | 0,1 | 0,9 | 170/382 | 44,5 | 60/81 | 74,1 | 52/130 | 40,0 | 6,5 |
| 2014 | PHI | 82 | 17,9 | 7,5 | 2,7 | 2,1 | 1,0 | 0,1 | 0,8 | 237/541 | 43,8 | 71/97 | 73,2 | 70/166 | 42,2 | 8,5 |
| 2013 | MIN | 78 | 19,8 | 10,3 | 2,8 | 3,3 | 0,8 | 0,2 | 1,3 | 318/688 | 46,2 | 79/109 | 72,5 | 91/210 | 43,3 | 11,1 |
| 2012 | DEN | 82 | 20,6 | 6,8 | 3,1 | 3,8 | 1,1 | 0,1 | 1,0 | 221/454 | 48,7 | 57/91 | 62,6 | 56/129 | 43,4 | 10,6 |
| 2011 | DEN | 26 | 5,9 | 3,0 | 1,0 | 1,1 | 0,3 | 0,0 | 0,4 | 28/56 | 50,0 | 16/23 | 69,6 | 7/18 | 38,9 | 3,6 |
| 2010 | IND | 82 | 11,3 | 3,8 | 1,9 | 1,5 | 0,5 | 0,1 | 0,7 | 126/316 | 39,9 | 25/39 | 64,1 | 35/101 | 34,7 | 4,7 |
| 2009 | IND | 75 | 21,6 | 6,1 | 3,4 | 1,9 | 1,1 | 0,2 | 0,7 | 182/381 | 47,8 | 46/75 | 61,3 | 46/106 | 43,4 | 9,0 |
| 2008 | IND | 78 | 18,9 | 5,0 | 2,8 | 1,3 | 0,9 | 0,1 | 0,6 | 150/338 | 44,4 | 40/65 | 61,5 | 47/108 | 43,5 | 6,7 |
| 2007 | IND | 77 | 31,5 | 9,4 | 4,6 | 2,3 | 1,3 | 0,4 | 1,2 | 281/676 | 41,6 | 92/142 | 64,8 | 69/194 | 35,6 | 11,0 |
| 2006 | IND | 78 | 30,1 | 15,8 | 4,2 | 4,8 | 1,4 | 0,3 | 1,7 | 498/1137 | 43,8 | 129/185 | 69,7 | 111/307 | 36,2 | 15,9 |
| Total | - | 740 | 20,1 | 7,6 | 3,0 | 2,5 | 0,9 | 0,2 | 1,0 | 2211 / 4969 | 44,5 | 615 / 907 | 67,8 | 584 / 1469 | 39,8 | 9,1 |
Stats by 36'
| Yr | Team | G | PPG | RPG | APG | SPG | BPG | TPG |
|---|---|---|---|---|---|---|---|---|
| 2015 | 76ers | 82 | 13,0 | 5,3 | 3,7 | 1,8 | 0,3 | 2,0 |
| 2014 | 76ers | 82 | 15,1 | 5,5 | 4,2 | 1,9 | 0,2 | 1,7 |
| 2013 | Timberwolves | 78 | 18,8 | 5,1 | 6,0 | 1,5 | 0,3 | 2,3 |
| 2012 | Nuggets | 82 | 11,8 | 5,4 | 6,6 | 1,9 | 0,2 | 1,8 |
| 2011 | Nuggets | 26 | 18,5 | 5,8 | 6,5 | 1,6 | 0,2 | 2,6 |
| 2010 | Pacers | 82 | 12,2 | 6,2 | 4,9 | 1,6 | 0,4 | 2,3 |
| 2009 | Pacers | 75 | 10,1 | 5,7 | 3,2 | 1,8 | 0,4 | 1,2 |
| 2008 | Pacers | 78 | 9,5 | 5,3 | 2,4 | 1,6 | 0,2 | 1,1 |
| 2007 | Pacers | 77 | 10,7 | 5,2 | 2,6 | 1,5 | 0,4 | 1,3 |
| 2006 | Pacers | 78 | 19,0 | 5,0 | 5,7 | 1,7 | 0,3 | 2,0 |

